
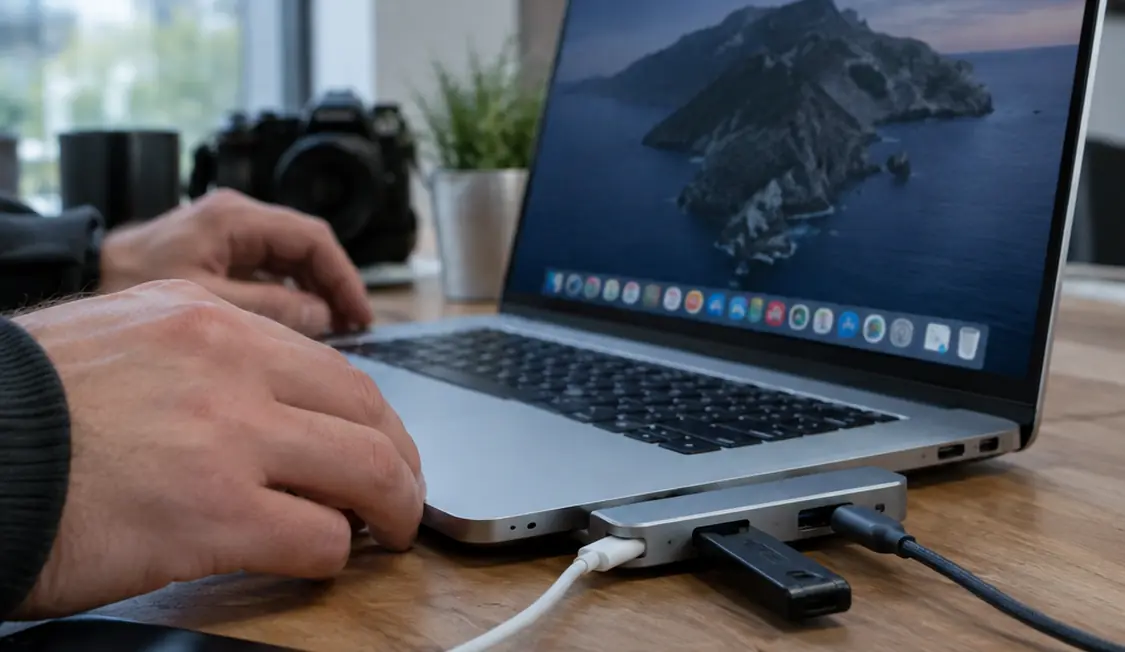
Establishing a Stable Baseline for System Feedback
Choosing the wrong enhancement can turn a glanceable status signal into Dock crashes, login delays, or an installer that refuses to run. The standard is strict—each indicator must communicate something actionable without requiring the user to open another window. Live indicators using polling intervals of 1 to 3 seconds provide immediate feedback on system health. The seven functions are download progress, unread mail, CPU use, network traffic, disk activity, mounted volumes, and running-application visibility.
Verifying Architecture and Point Release Compatibility
A generic claim of OS X compatibility provides insufficient detail for system modifications. You must verify the exact OS X 10.5.0 through 10.5.8 point release running on the machine. You also need to confirm whether the hardware uses a 32-bit PowerPC or Intel architecture. Enhancements generally fall into three implementation types: Apple-provided Dock behavior, an application updating its own icon, and a system-wide Dock modification.
Isolating the Installer Environment
Test the installer in a non-admin account to monitor resource changes. Universal binary patchers for older widgets frequently corrupted the Dock package on Intel architectures. A safer approach is to back up your altered Dock resources and preserve the original installer package before making system-level changes.
Tracking Large File Transfers on the Application Icon
A progress ring or completion badge on the downloading application's Dock icon offers the fastest way to tell whether a large transfer is moving or stalled. Native application badges keep this data within the application that owns it. Keeping the update mechanism confined to a single application prevents global Dock crashes during heavy input/output operations.
Command-H Rendering Limitations
With 100MB to 500MB archive files, the progress ring generally renders reliably under normal conditions. The progress ring overlay fails to render accurately when the host application is hidden via the Command-H shortcut during active file transfers. Keep the downloading application visible in the background to maintain an accurate visual status.
Monitoring Unread Messages Through Native Mail Badges
Apple Mail tracks incoming communications through its own unread indicator. This count lets a user judge whether opening the mail client is worthwhile without leaving their current task. You must verify which specific mailboxes contribute to the badge and ensure your filtering rules do not leave unwanted messages marked as unread.
Tracking SQLite Database Desyncs
Third-party cosmetic changers often desync from the actual SQLite database count during IMAP synchronization. Relying on the native Mail badge avoids this database conflict entirely. Expect IMAP synchronization delays of 15 to 45 seconds before the badge updates to reflect the server status.
Converting Activity Monitor into a Live Processing Graph
Activity Monitor can convert its standard Dock icon into a live CPU display. This gives users a built-in diagnostic signal without installing another utility. While visual Dock enhancements are restricted to non-destructive 32-bit Intel and PowerPC compatible point releases prior to OS X Snow Leopard, these native tools provide reliable diagnostics throughout the operating system lifecycle.
Configuring this diagnostic workflow involves setting Activity Monitor to launch at login and minimizing it immediately. The CPU history graph updates at 2-second intervals. Sustained activity on this graph helps identify when a slow interface is caused by ongoing processing rather than a frozen Dock.
Exposing Background Traffic with Network Data Views
Switching the Activity Monitor Dock icon to Network Data provides a way to notice background transfers, mail synchronization, or a download that continues after its window is hidden. This visual correlation helps identify hidden application behavior, an important diagnostic step for vintage systems. The indicator shows activity rather than intent. It cannot identify whether the traffic is useful, expected, or associated with one particular application.
Peak traffic spikes exceeding 50 KB/s on idle connections warrant further investigation. Pair this Dock signal with a practical response. Open Activity Monitor or the suspected application when traffic persists unexpectedly to see exactly which process is consuming bandwidth.
Distinguishing Hard Locks from Heavy Storage Operations
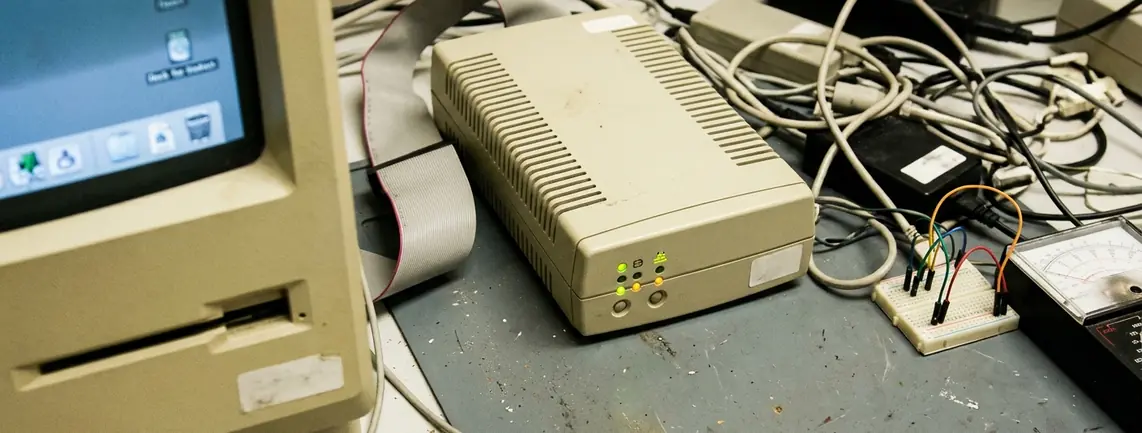
The disk activity display helps distinguish a machine doing sustained storage work from one that is simply unresponsive. Monitoring the read/write color coding during system stalls clarifies what the hardware is attempting to process. Sustained read/write operations lasting longer than 10 to 15 seconds during Spotlight indexing represent normal system behavior.
Other common scenarios include copying a large folder, opening a disk image, or heavy virtual-memory use. Visible disk activity does not diagnose a failing drive. Treat this indicator as a workload monitor rather than a hardware health test.
Managing Removable Media with a Dedicated Folder Alias
Structuring the volume management workflow involves placing a dedicated mounted-volumes folder alias next to the Trash. This arrangement makes attached disks, disk images, and network volumes easier to spot and open. It also keeps removable media visible before physical ejection.
This provides a practical benefit for vintage systems. Mounting .dmg and .iso disk images ranging from 5MB to 4GB happens frequently when installing and archiving software. If you use a dedicated utility instead of a folder alias, you must check compatibility for the exact processor architecture.
Replacing the Default CoreServices Application Indicator
Enhancing the visibility of running applications requires extracting the default indicator graphic from the CoreServices framework. You can replace it with a higher-contrast version rather than applying a full theme replacement. This modification keeps the system lightweight and avoids the overhead of third-party customization engines.
The process involves modifying a 7x3 pixel translucent image file within /System/Library/CoreServices/Dock.app. Back up the original file before moving the new graphic into the package contents. Restart the Dock process via Terminal to see the higher-contrast indicator appear beneath your active applications.
Evaluating Your First Diagnostic Addition
Add indicators one at a time. Running a single indicator for a 48-hour evaluation period allows you to evaluate its actual utility before adding another variable to your workflow. Stacking multiple visual changes at once makes it difficult to determine which modification is causing a performance drop or visual distraction.
Which of these seven indicators will you activate first to monitor your system's daily workload?







Discussion
Share your thoughts.
Write a Comment